- APE accumulation increased as price dropped.
- Indicators looked bearish and suggested a further downtrend.
ApeCoin [APE] has been experiencing selling pressure for quite a few days, as was evident from its recent price action. According to CoinMarketCap, APE registered over 14% decline in its price over the last seven days, and at the time of writing, it was trading at $5.05 with a market capitalization of over $1.86 billion. Interestingly, Lookonchain revealed that APE’s buying and staking were on the rise since the collusion months of 2022.
The largest $APE staking address received 300,000 $APE ($1.7M) from #Binance 1 hour ago.
And currently staked a total of 2.29M $APE ($13M).https://t.co/BkwtYm8AfX pic.twitter.com/ZwpsKBKQXz
— Lookonchain (@lookonchain) February 9, 2023
Read ApeCoin’s [APE] Price Prediction 2023-24
On 10 February, the largest APE staking address received 300,000 APE from Binance, which was worth $1.7 million. However, during the latest bull rally in 2023, investors sold their tokens at a comfortable margin of profit. This increased selling pressure was the main reason for APE’s recent price decline.
Despite the decline, recent data suggested the possibility of a trend reversal as the selling pressure might come to an end. Lookonchain also pointed out that Machi Big Brother bought 10,000 APE for 52,910 USDT.
Machi Big Brother bought 10,000 $APE with 52,910 $USDT 6 hrs ago, the buying price is $5.29.
After selling $APE for 20 consecutive days, he starts buying $APE today.https://t.co/MsT7uVYReM pic.twitter.com/Ij9lvcBvTO
— Lookonchain (@lookonchain) February 10, 2023
Are ApeCoin investors accumulating?
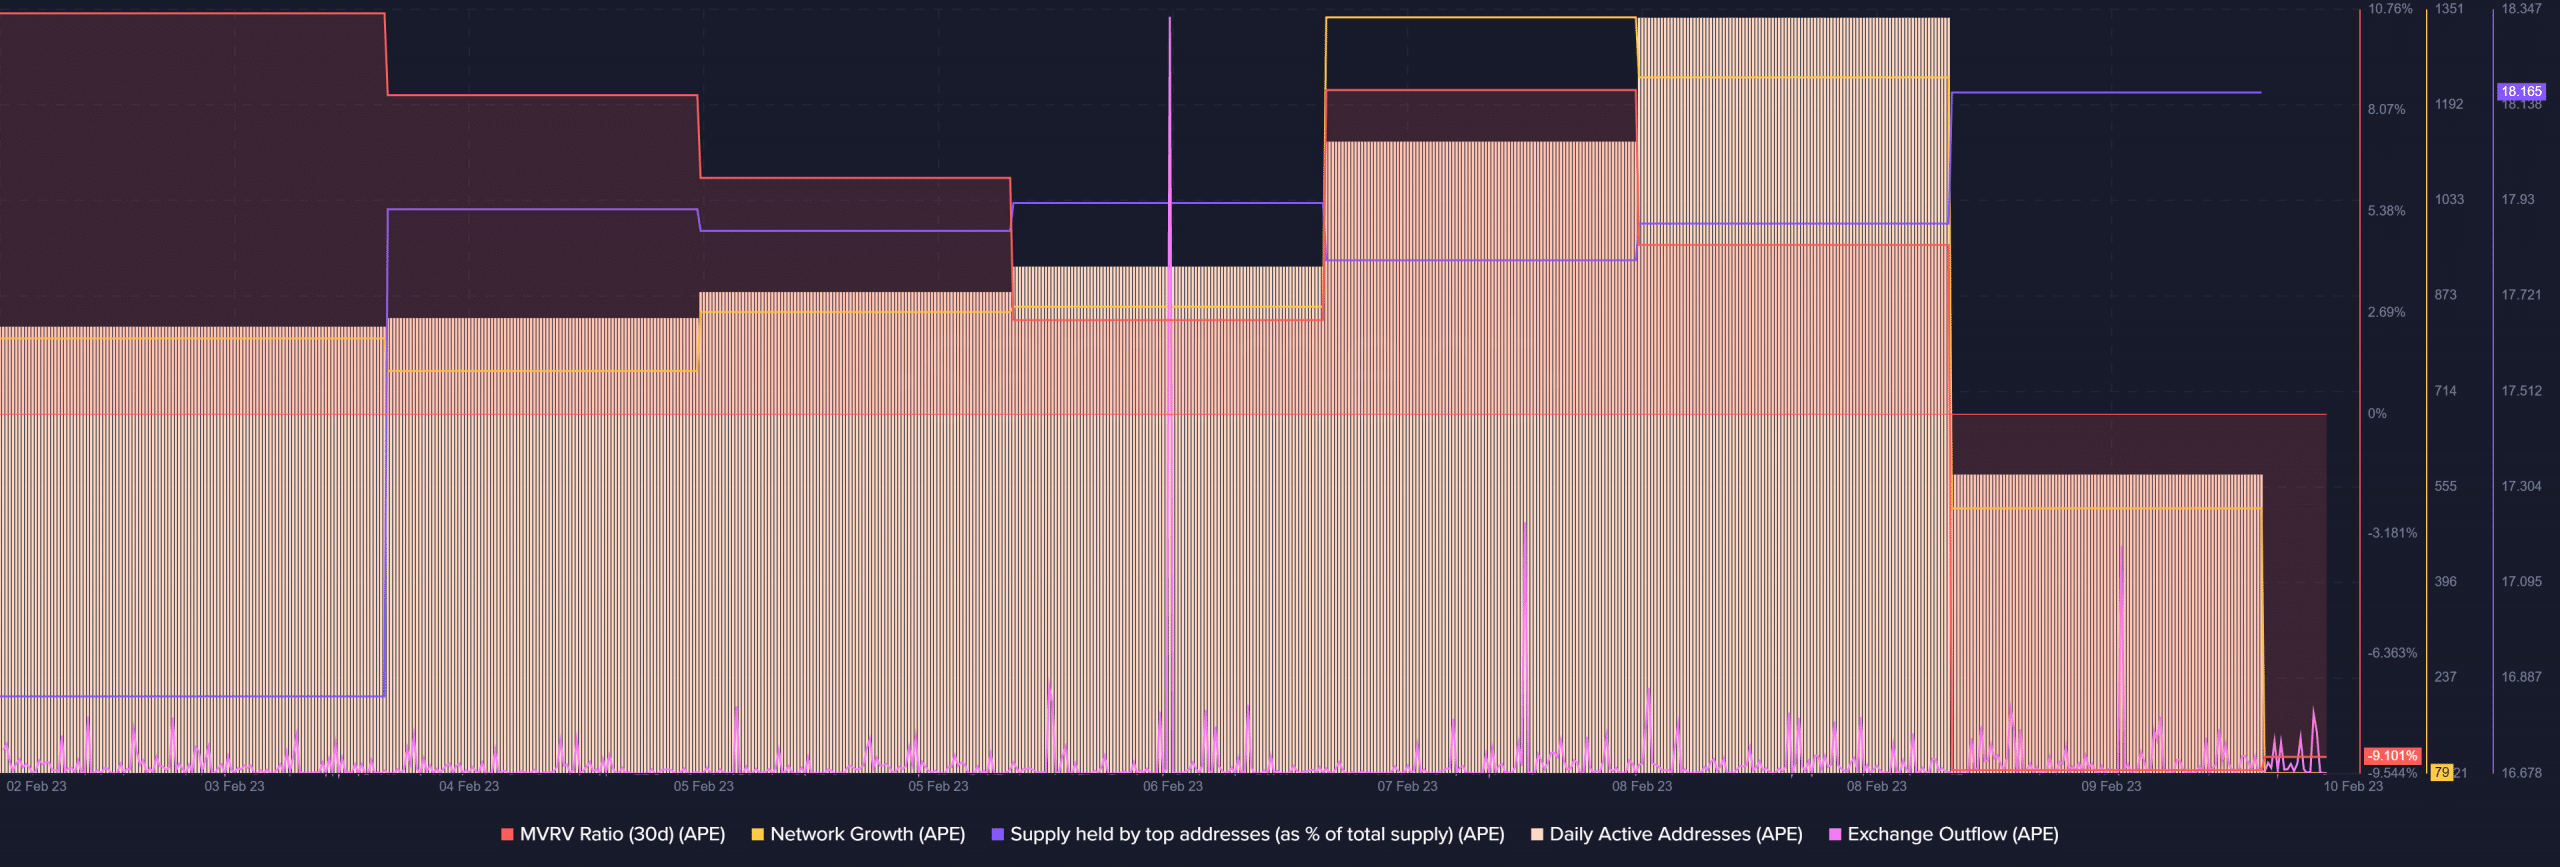
As per Santiment’s data, APE’s supply held by top addresses registered an uptick in the last week, which showed that the investors were accumulating APE when its price was lucrative. APE’s exchange outflow also spiked quite a few times in the last seven days, which was a positive development.
Moreover, APE’s daily active address and network growth followed the trend of the bull market, reflecting a larger number of users in the network. However, APE’s MVRV Ratio was considerably lower, suggesting the possibility of a further price decline.

Source: Santiment
Realistic or not, here’s APE market cap in BTC’s terms
Concerns still remain
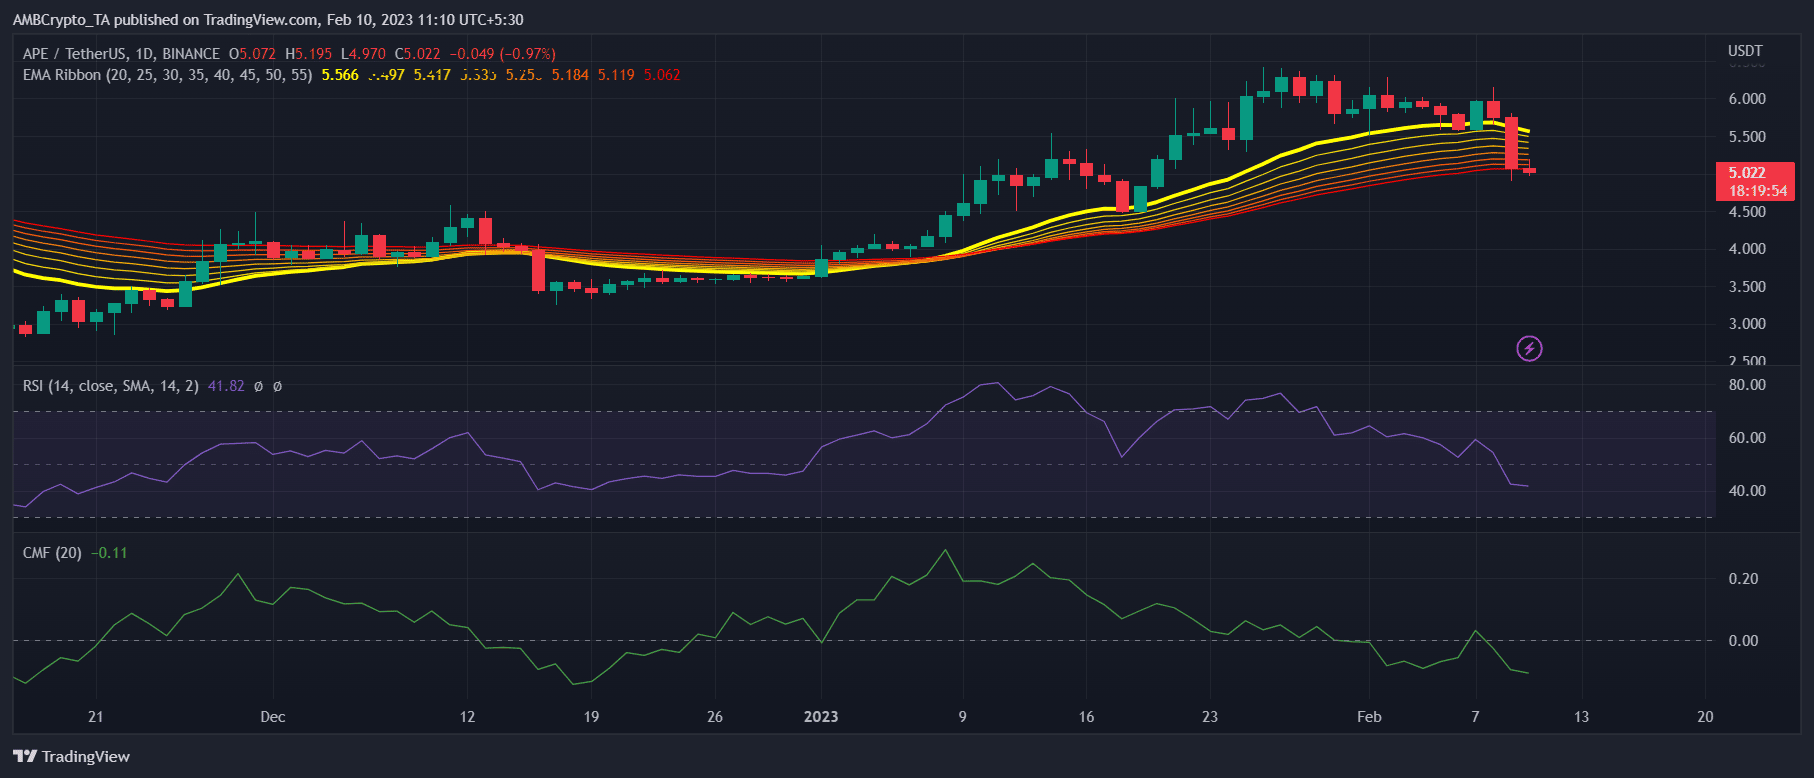
Though a few metrics looked optimistic, APE’s daily chart showcased some concerns. For instance, APE’s Relative Strength Index (RSI) registered a downtick, which was a development in the bears’ favor. APE’s Chaikin Money Flow (CMF) also followed a similar path and was heading further below the neutral mark, increasing the chances of a continued downtrend.
Lastly, the Exponential Moving Average (EMA) Ribbon provided much-needed hope as its data revealed that the bulls still had the upper hand in the market.

Source: TradingView


