PATNA (CoinChapter.com) — Play-to-earn (P2E) gaming platform Volt’s native token Volt Inu’s price spiked more than 144% in the first week of Feb to reach a daily high of $0.00000157 on Feb 7. The VOLT token price rallied as Volt developers proposed to burn 44.85 trillion VOLT tokens.

In addition, the team behind Volt introduced a proposal to withdraw 25% of Uniswap liquidity for the deployment and listing of VOLT on the Polygon blockchain. The Volt Inu Polygon listing proposal was the result of a series of requests from the VOLT community.
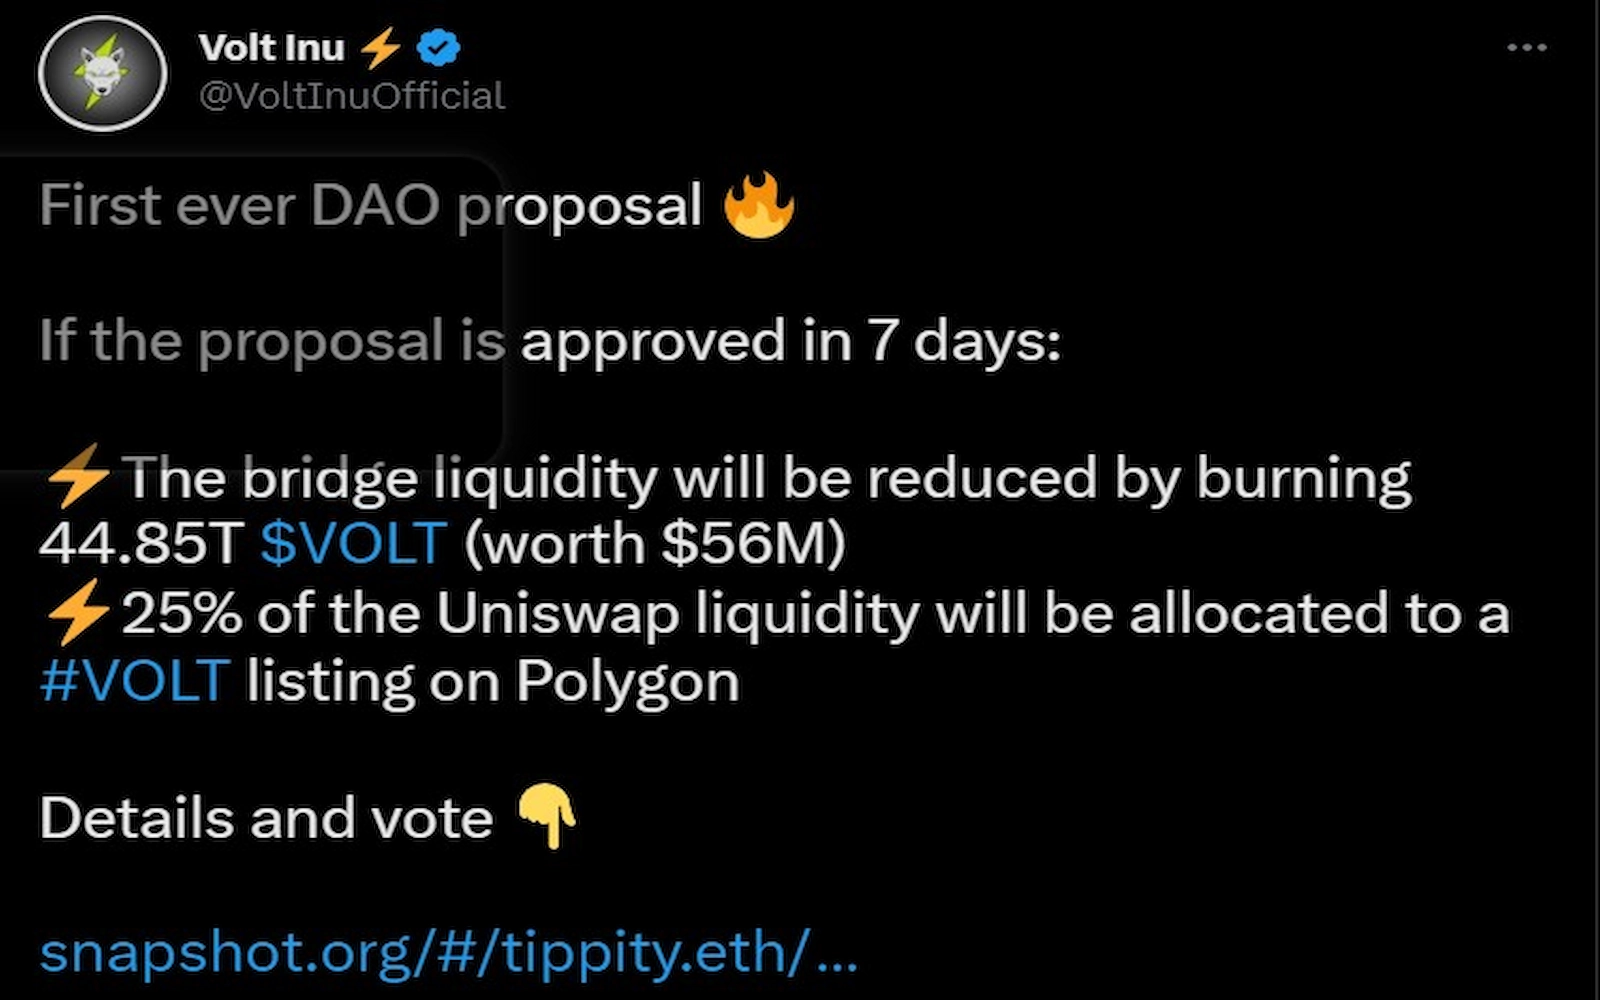
The developers put forward a DAO proposal for the community to vote on the burn event and the Volt Polygon listing. Moreover, developers believe the Volt Inu Polygon listing would allow the team to “more effectively allocate the liquidity pools.”
On the other hand, the Volt token burn event aims to reduce the liquidity of its cross-chain bridge. The team stated that the reducing the bridge liquidity would help cushion the impact of any potential exploit or hack.
Meanwhile, the 44.85 trillion token’s rose to a value of $69.5 million, thanks to the VOLT price’s recent rally.
VOLT INU Price Confirms Bullish Technical Pattern
The recent price rally helped the Volt Inu V2 token confirm a bullish technical pattern called the Falling Wedge pattern.
Also Read: A growing number of adults in the US take money from their parents to survive amid growing inflation
In detail, the technical pattern forms when the price fluctuates inside a pair of falling trendlines that would converge down the slope. The outcome of such downside patterns is typically a price breakout to the upside.
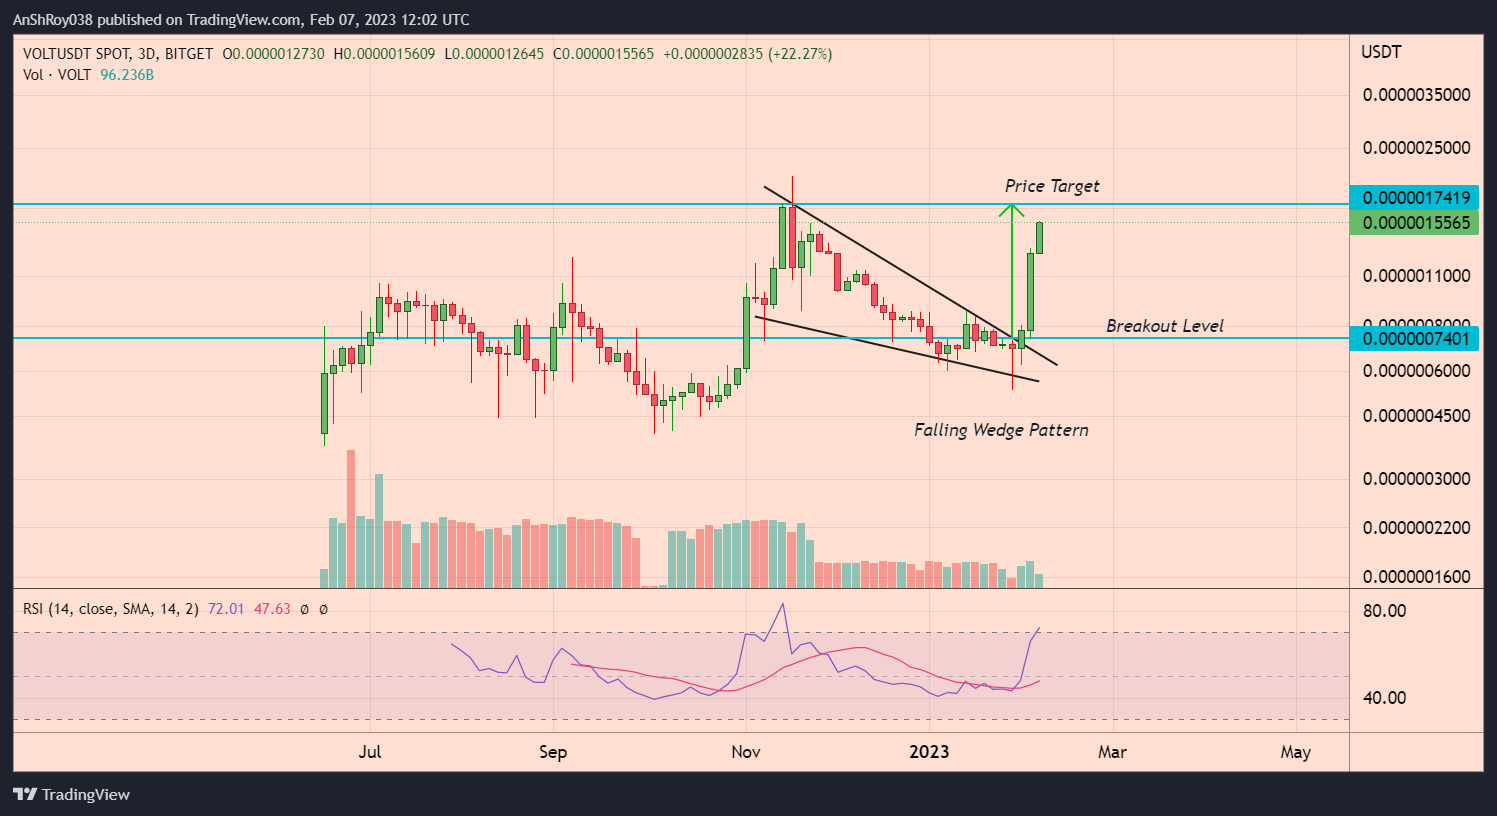
The upside target for the breakout is equal to the maximum distance between the falling wedge’s upper and lower trendlines. Hence, the pattern had a price target of $0.000001742, a jump of 135% from the breakout level of $0.00000074.
The Volt Inu coin price’s ongoing rally helped the token achieve 106.5% of the calculated price target.
VOLT Price Rally Ignores Overbought Levels; How Long Will It Last?
The Volt token price’s recent rally witnessed bulls ignoring the VOLT’s overbought RSI levels, clocking 86.27 on the daily chart. Historically, overbought RSI levels have often predicted upcoming bearish trend reversal for an asset.
As a result, market participants often consider the pattern a sell signal, which is why VOLT price likely painted a long upper wick on Feb 7’s daily candle, suggesting an increase in selling pressure. Should the selloff continue, VOLT INU coin price might drop to test support near $0.00000142.
Also Read: Bill Gates Gets Into Catfight with Fellow Billionaire Elon Musk Over His Mission Mars
Additionally, breaching the immediate support could force VOLT price to fall to support near $0.00000122 before recovering.
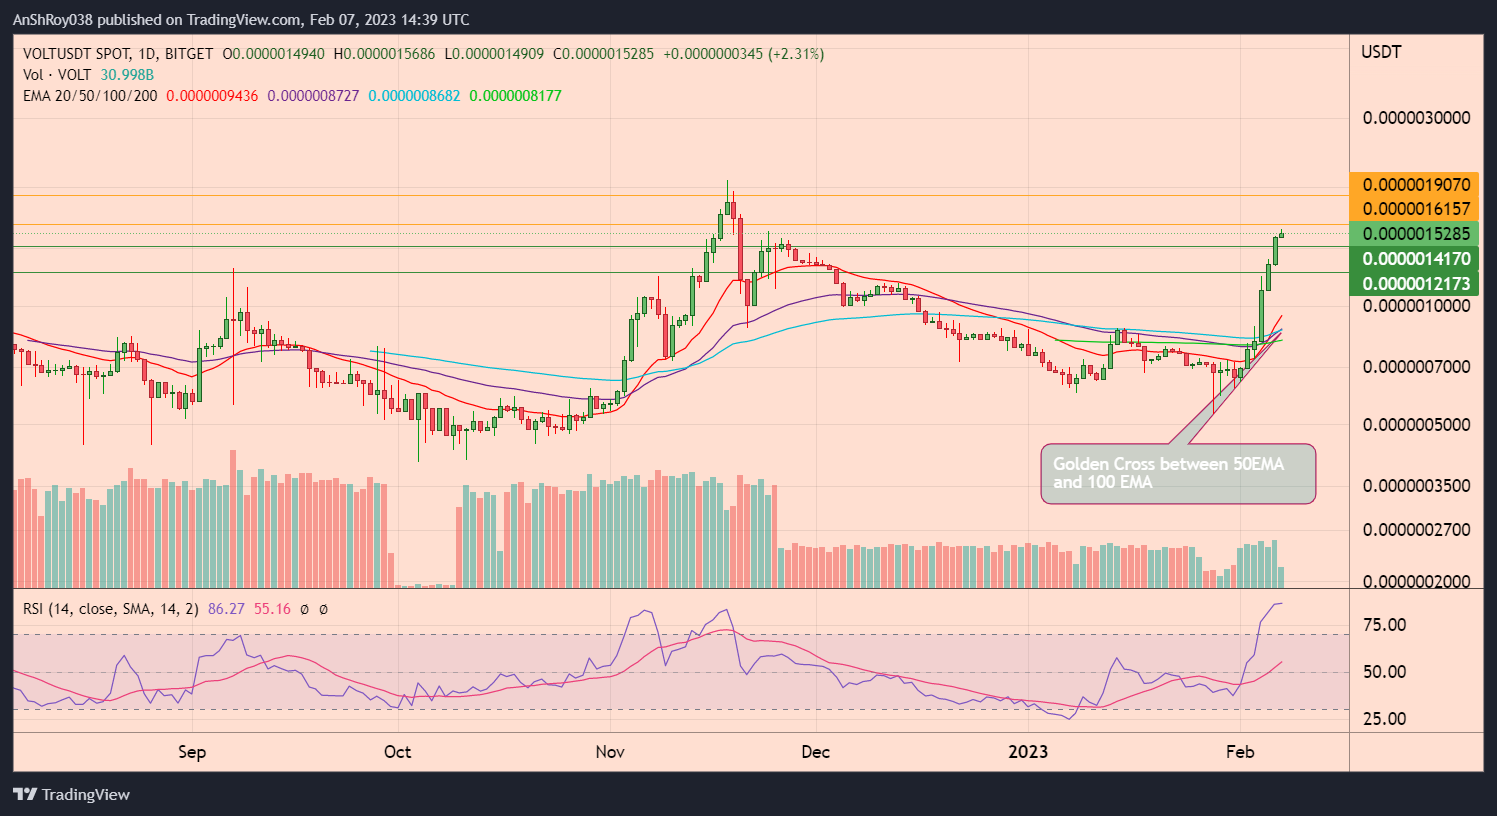
On the other hand, Volt Inu’s price action helped the token’s 50-day EMA (purple wave) move above its 100-day EMA (blue wave) to form a bullish technical pattern called the golden cross. Market participants usually consider the pattern an indicator of bullish investor sentiment and a buy signal.
Hence, if buyers move in, VOLT price might rise to resistance near $0.00000162. A sustained rally could force the Volt Inu coin to break above immediate resistance and challenge $0.00000191 before downside corrections pare gains.
The post VOLT INU Price Spikes 144% In A Week, Buoyed By Token Burns And Polygon Listing News appeared first on CoinChapter.