Disclaimer: The information presented does not constitute financial, investment, trading, or other types of advice and is solely the writer’s opinion.
- The near-term momentum took a U-turn from bearish to bullish in a matter of hours.
- The strong pump past $0.395 meant a retracement could follow.
Bitcoin [BTC] surged from $21.6k to $24.8k within 36 hours. This near-term rally began on 14 February, but is was unclear whether the run had ended. Meanwhile, Ripple [XRP] also broke the lower timeframe bearish structure.
Is your portfolio green? Check out the XRP Profit Calculator
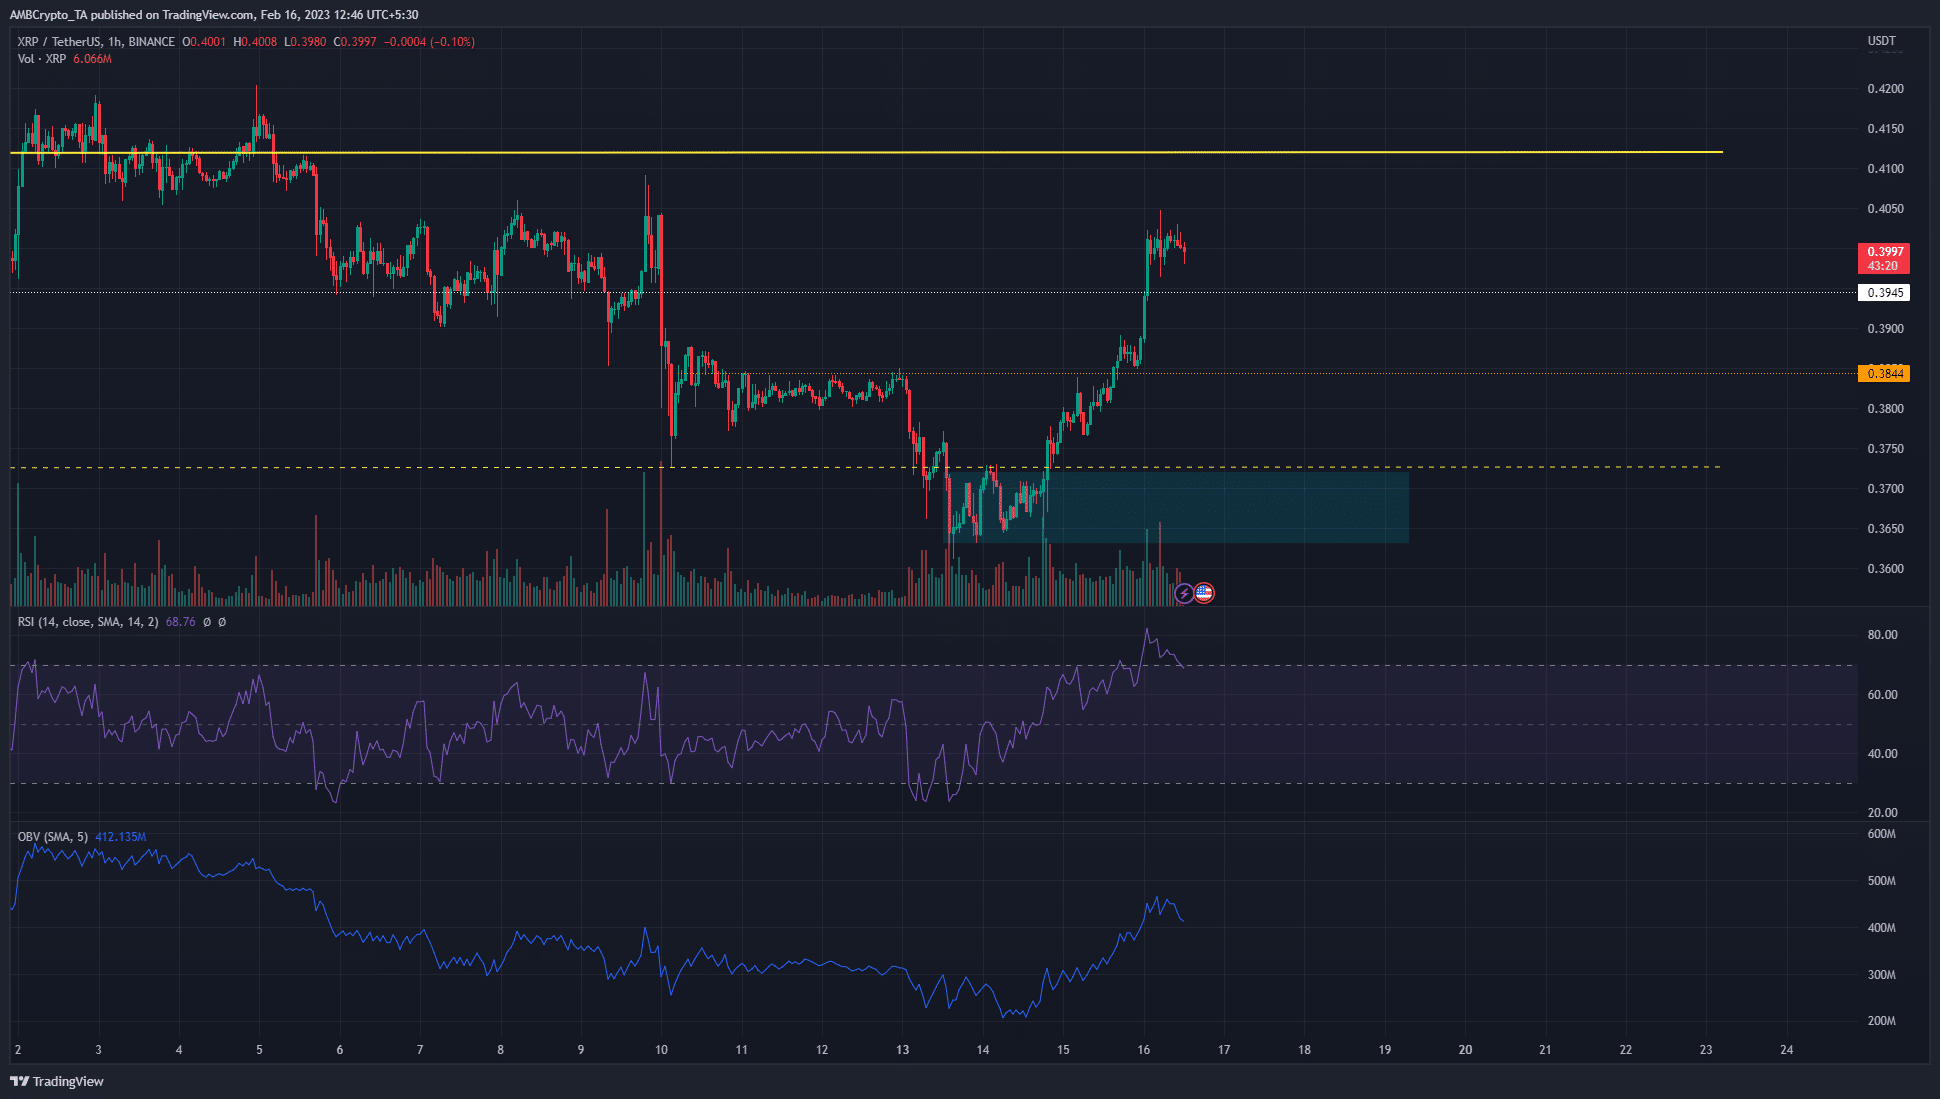
A 16 February article highlighted that $0.387 and $0.395 will be significant resistance levels for XRP bulls. These levels were broken cleanly in recent hours of trading. Has the breakout revealed the market’s bullish hand, or will all the gains be retraced?
Strong surge leaves inefficiencies in the south

Source: XRP/USDT on TradingView
The daily timeframe showed the mid-range mark at $0.37 has once more acted as a strong support zone. The breakout past $0.395 meant a move to the range highs at $0.41 was likely. However, the strong gains and the imbalances on the one-hour chart meant buying XRP at $0.4 might not be a good risk-to-reward trade.
The RSI declined from oversold territory. This does not indicate a pullback in the works by itself, but showed that the market could be overextended. The OBV saw a healthy rise to underline demand behind XRP. In the meantime, Bitcoin itself faces resistance in the $24.8k-$25.2k territory. A consolidation phase for BTC could give time for XRP to retrace and surge toward $0.42.
If the bulls are in control of the market, any retracement that XRP notes toward $0.38 or $0.39 would be accompanied by very little selling pressure. Hence, the OBV might not show a large dip.
The $0.384-$0.388 area can be used to re-enter long positions, with a tight stop-loss below $0.38. A deeper pullback beneath $0.38 is likely to test the bullish order block just beneath $0.37, highlighted in cyan.
How much are 1, 10, 100 XRP worth today?
The funding rate and rising Open Interest indicate bullish sentiment

Source: Coinalyze
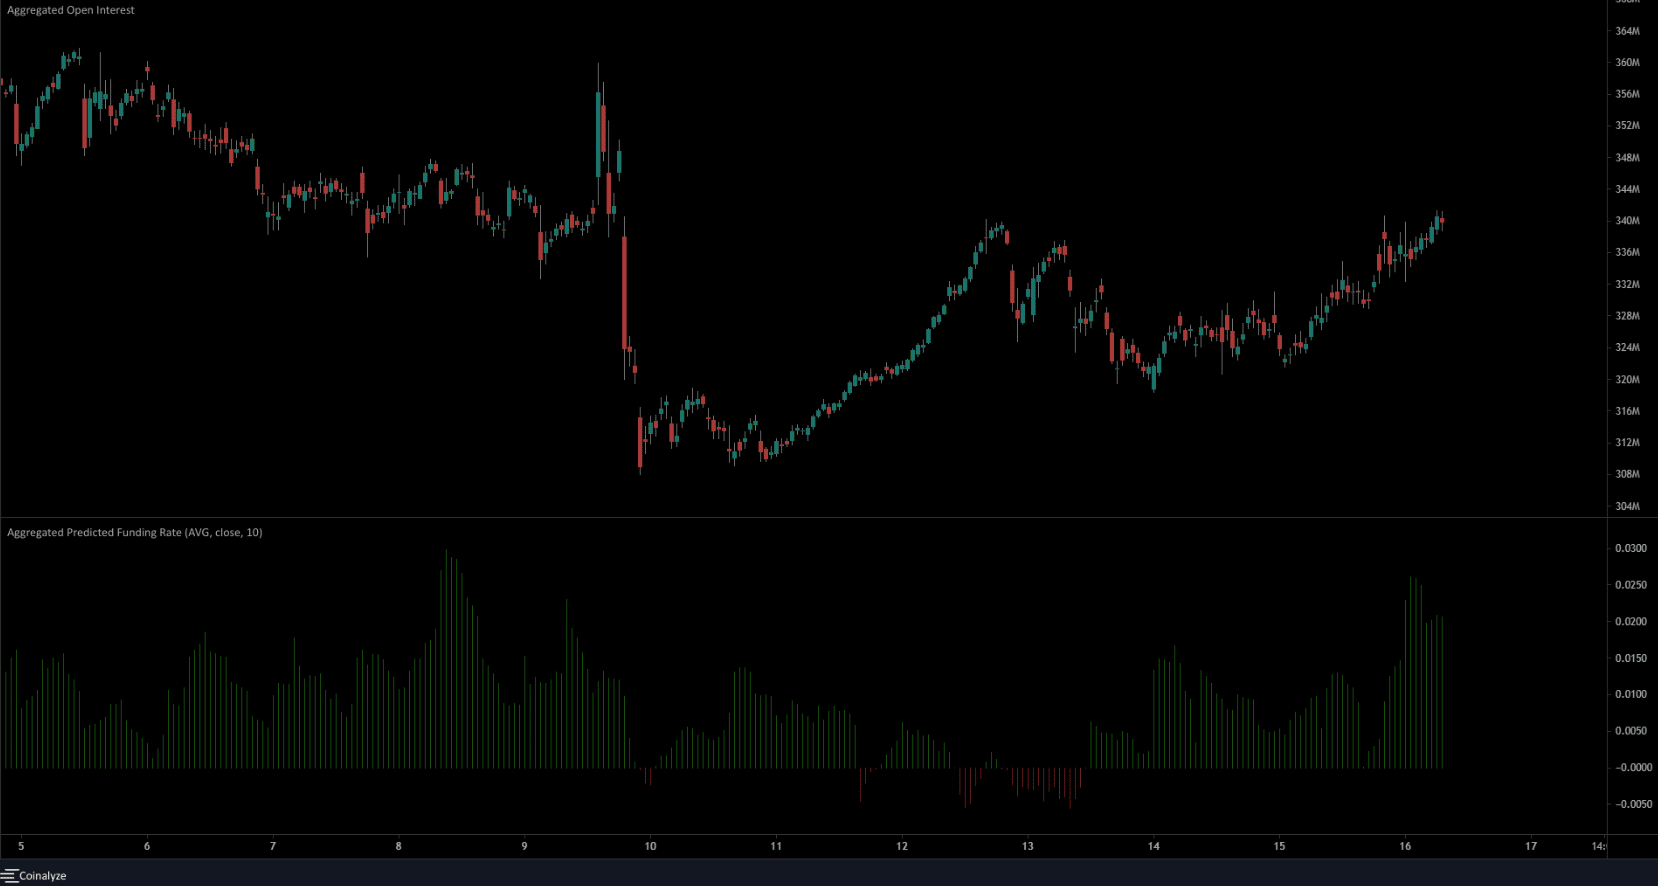
Since 10 February, the Open Interest made higher lows on the one-hour chart. Coinalyze’s data showed that there was a sentiment shift to the bearish side on 13 February, as the predicted funding rate fell to negative values. A local bottom was formed when XRP traded at $0.366 – the surge over the past couple of days showed bears their error.
Moreover, Open Interest and funding rates rose on 14 February. The OI showed capital flow into the market and the funding rate showed long positions were favored once more.


